Core Web Vitals Under the Hood: What LCP, INP, and CLS Actually Measure and Why Each Metric Behaves Differently
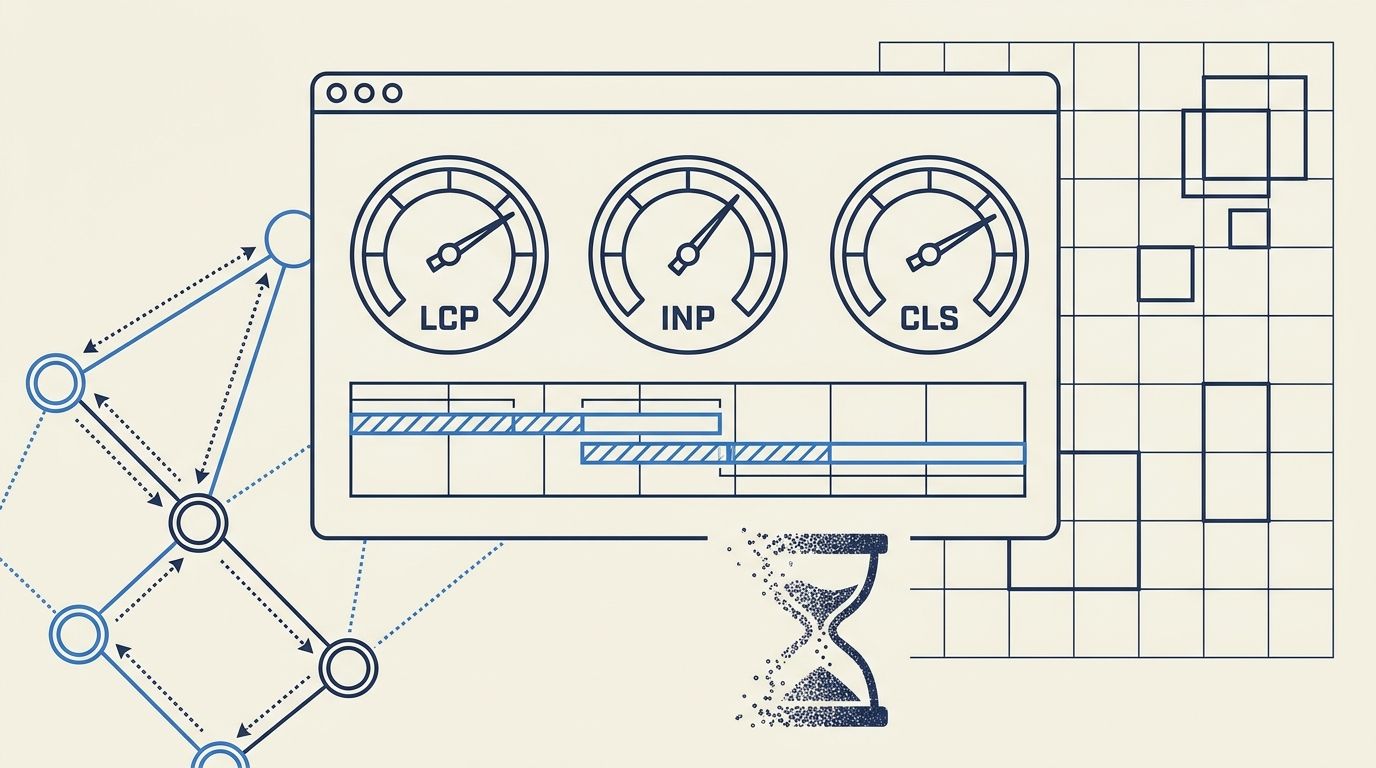
LCP, INP, and CLS each target a different dimension of page experience (loading speed, interactivity, visual stability), but they share almost nothing in how they collect data, when they fire, or what browser events they observe.
Core Web Vitals Under the Hood: What LCP, INP, and CLS Actually Measure and Why Each Metric Behaves Differently
LCP, INP, and CLS each target a different dimension of page experience (loading speed, interactivity, visual stability), but they share almost nothing in how they collect data, when they fire, or what browser events they observe. That disconnect explains why fixing one metric often leaves another untouched or actively degrades it.
How LCP Selects Its Element
LCP doesn't measure when your page "finishes loading." It tracks the render time of the single largest content element visible in the viewport, and the browser re-evaluates that choice as new elements appear. According to Google's web.dev documentation, the element types considered include images, video poster frames, background images loaded via CSS, and block-level text nodes. A good LCP score is 2.5 seconds or less.
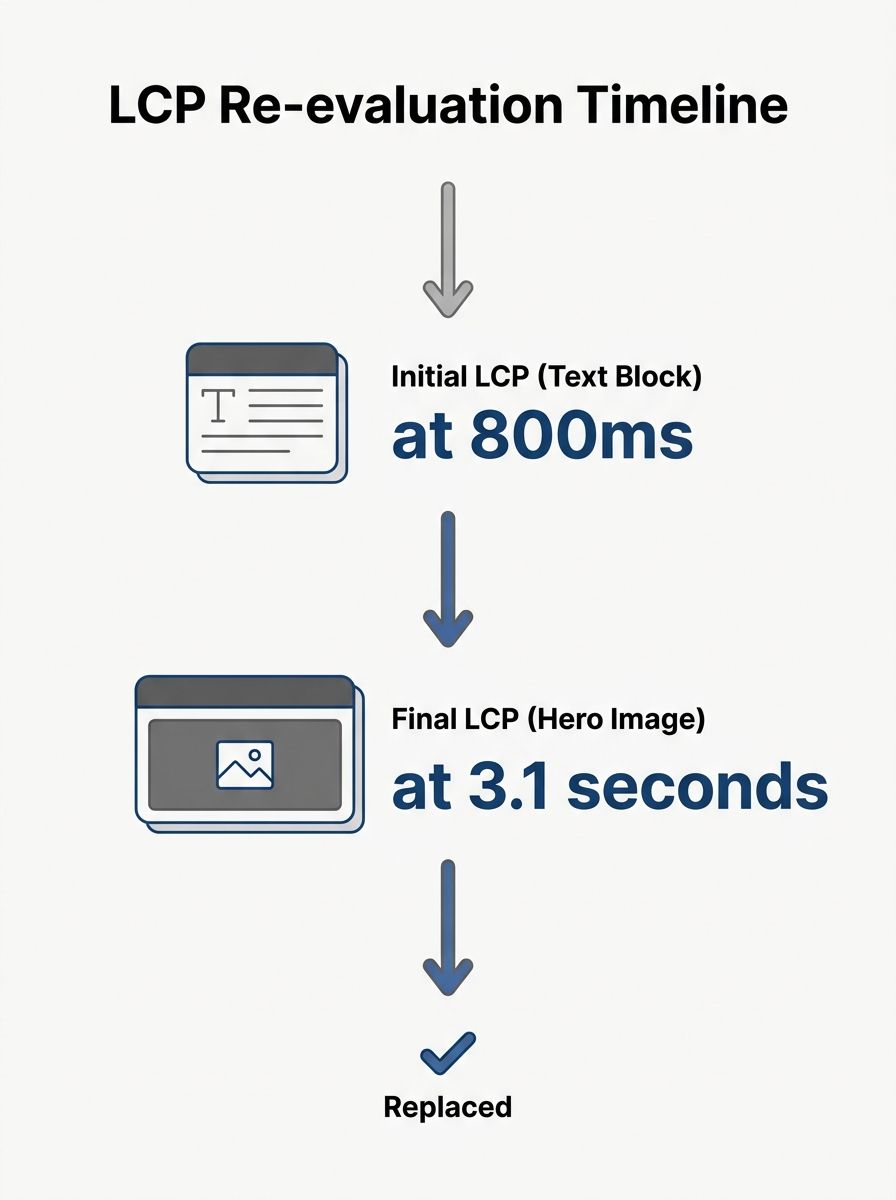
Here's the part most people miss: the LCP candidate changes as the page loads. An early heading might be the LCP element at 800ms, but when a hero image finishes rendering at 3.1 seconds, that image becomes the new candidate and the score jumps to 3.1s. Only the final LCP entry before the user's first interaction matters for your CrUX data.
This dynamic selection creates a specific debugging pattern. You can't work on LCP optimization without first identifying which element the browser selects on a given page. Run a Lighthouse trace or check the Performance panel in DevTools, and look at the LCP entry. If your LCP element is a hero image, preloading it and setting fetchpriority to high is the direct fix. If it's a text block waiting on a web font, font-display strategies matter more.
As of 2026, 68% of websites pass the 2.5-second LCP threshold. That's a decent pass rate, partly because image optimization has gotten easier with modern formats like AVIF and WebP. But the 32% that fail often optimize the wrong element entirely: shrinking a sidebar graphic while the hero banner loads lazily at 4 seconds.
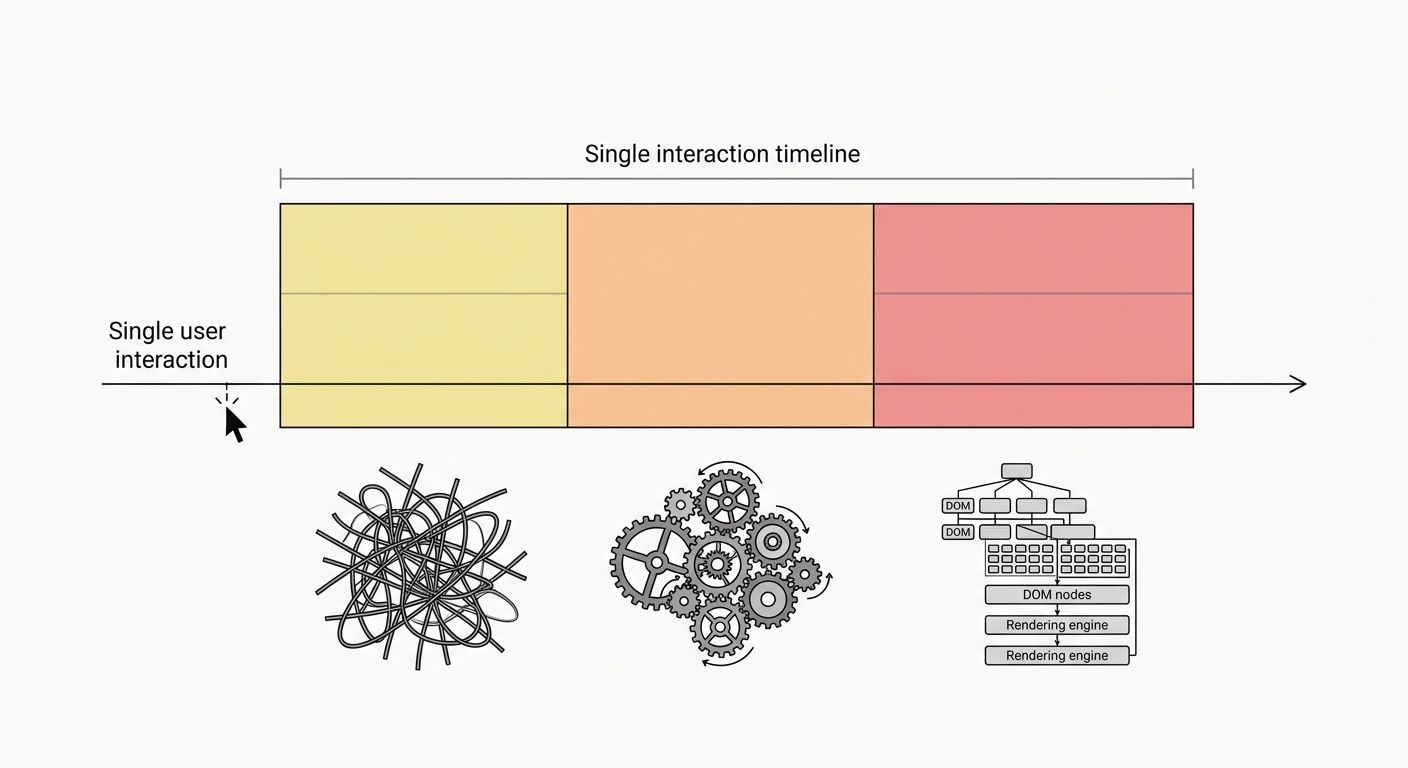
The Three Phases Inside Every INP Measurement
Interaction to Next Paint replaced First Input Delay as the official responsiveness metric in March 2024. The reason was structural: FID measured only the delay before the browser could begin processing the very first user interaction, and everything after that first click was invisible. As MDN's documentation explains, INP measures for a longer period, beginning at the input delay, followed by event handler processing time, and ending when the browser paints the next frame.
Those three phases fail for different reasons, which is why this metric is worth understanding in pieces:
Input delay is the gap between the user's action (tap, click, keypress) and the browser starting to run the event handler. This phase fails when the main thread is busy with a long JavaScript task or third-party script. The browser literally can't begin processing your click because it's still executing something else.
Processing time is how long your event handlers take to run. If a click triggers a function that recalculates a complex data table or re-renders a component tree, this phase balloons. Framework hydration in React, Vue, and similar tools is a frequent source of processing-time spikes on otherwise fast pages.
Presentation delay is the time from when handlers finish to when the browser actually paints the visual update. This phase suffers when handlers trigger expensive style recalculations or layout reflows that the rendering pipeline struggles to resolve.
INP doesn't simply report the worst interaction. It uses a heuristic: for pages with fewer than 50 interactions, it takes the worst one; for pages with 50 or more, it approximates the 98th percentile. The "good" threshold is 200ms or less for the total of all three phases combined. Right now, 43% of websites fail that threshold, making INP the most commonly failed Core Web Vital by a wide margin.
When you're debugging technical SEO issues systematically, INP failures are among the hardest to reproduce because they depend on what users actually do. A page might score perfectly in lab tests (where automated tools don't interact with dropdown menus, accordions, or form fields) but fail badly in CrUX field data from real visitors.
How CLS Accumulates Through Session Windows
The cumulative layout shift causes more user frustration per pixel than any other metric, but its scoring mechanism is the least intuitive of the three. CLS doesn't measure a single moment. It tracks every unexpected layout shift throughout the entire page session and groups them into "session windows."
A session window is a burst of layout shifts where each shift occurs within 1 second of the previous one, and the total window doesn't exceed 5 seconds. The browser calculates a layout shift score for each window by multiplying two values: the impact fraction (what percentage of the viewport is affected) and the distance fraction (how far the element moved). Your CLS score is the score of the single largest session window, not the sum of all shifts across the visit.
This session window approach, documented by BrowserStack, replaced the original "sum of all shifts" model because that version penalized long-lived single-page applications unfairly. A user spending 20 minutes on a web app would accumulate tiny shifts that individually didn't matter but collectively destroyed the score.
The "good" threshold for CLS is 0.1 or less. With 78% of websites passing, CLS has the highest pass rate among Core Web Vitals. The fixes tend to be more deterministic than LCP or INP work: set explicit width and height attributes on images, videos, and iframes; reserve space for ad slots using CSS min-height; replace loading spinners with skeleton screens that match the dimensions of incoming content; and preload web fonts with appropriate font-display values to prevent text reflow.
One wrinkle that catches people: CLS excludes shifts that happen within 500ms of a user interaction. If someone clicks a button and a panel expands, that's an expected shift. But if an ad loads 3 seconds after page render and pushes content down, that's unexpected and counts against the score. The distinction between "user-initiated" and "browser-initiated" movement is the core of what CLS actually evaluates.
Metric | What It Measures | Good Threshold | 2026 Pass Rate | Most Common Failure Cause |
|---|---|---|---|---|
LCP | Time until largest visible content element renders | ≤ 2.5s | 68% | Unoptimized or lazy-loaded hero images |
INP | Total delay from user interaction to next paint | ≤ 200ms | 57% | Long JavaScript tasks, heavy frameworks |
CLS | Largest session window of unexpected layout shifts | ≤ 0.1 | 78% | Missing image dimensions, late-injected ads |
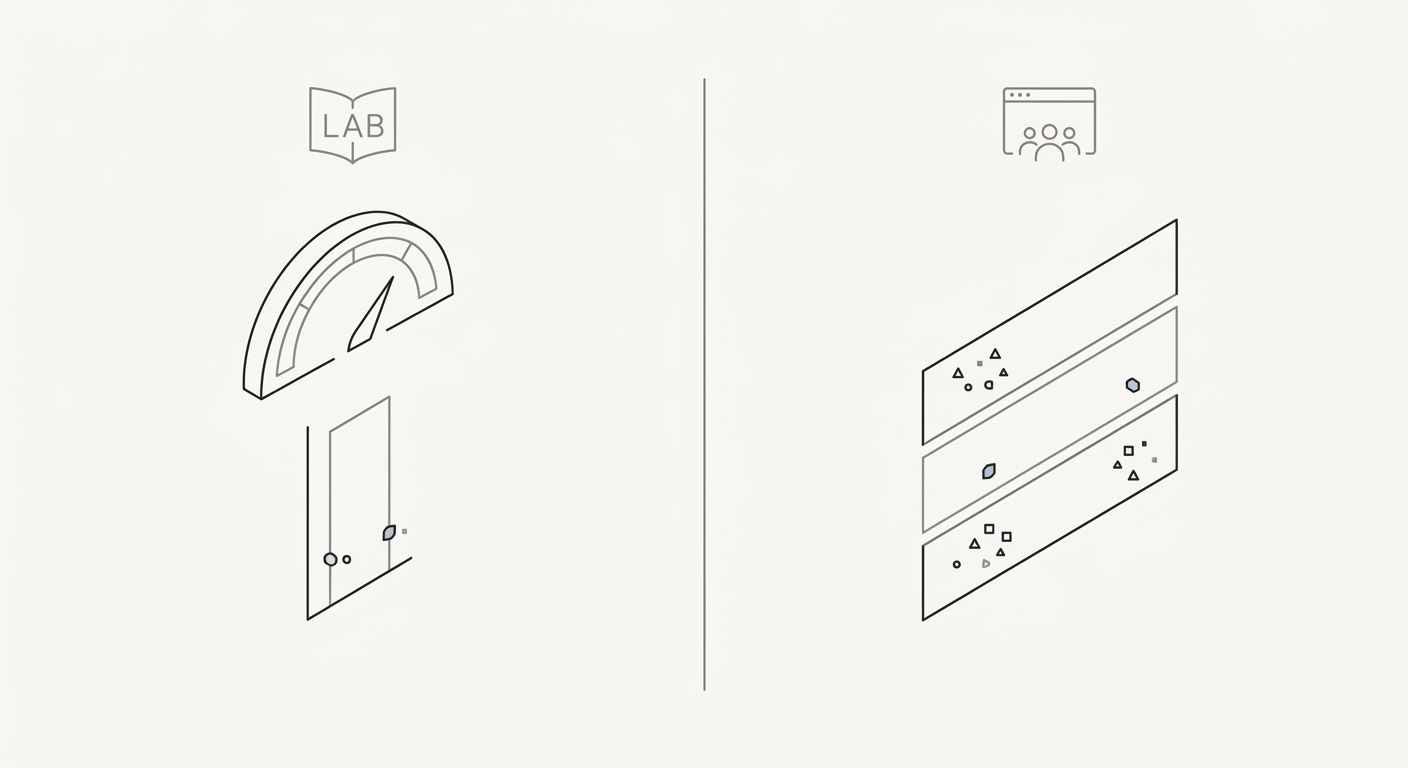
Why Field Data and Lab Data Disagree
Google evaluates page experience signals using CrUX (Chrome User Experience Report) field data, not lab tools like Lighthouse. This matters because the three metrics behave very differently depending on how they're measured.
LCP in a lab test runs on a simulated connection with consistent hardware. Field LCP reflects the actual network conditions and device capabilities of your visitors. A page that scores 1.8s LCP in Lighthouse can hit 4.2s for a user on a 3G connection with a mid-range Android phone. The element itself might differ: on mobile, a different element could be the largest in the viewport due to responsive layout changes.
INP literally cannot be measured in a standard Lighthouse run because Lighthouse doesn't interact with the page beyond loading it. You can get a proxy metric (Total Blocking Time correlates loosely), but real INP data requires real users clicking, typing, and tapping. This is why tracking performance with the right KPIs means checking CrUX data in Search Console or the CrUX API, not just Lighthouse scores.
CLS is where the gap between lab and field gets strangest. Lab tests measure CLS during initial page load only. Field CLS captures shifts throughout the entire visit, including shifts caused by lazy-loaded images below the fold, cookie consent banners that appear after 2 seconds, and chat widgets that inject themselves into the DOM minutes after arrival. A page with a perfect lab CLS can fail in the field because of a sticky notification bar that shows up on a 10-second delay.
Google's Search Central documentation is explicit about this: Core Web Vitals are a set of metrics that measure real-world user experience. The ranking evaluation uses the 75th percentile of field data across all visits to a URL or origin. Your Lighthouse scores are useful for diagnosis, but they aren't what Google uses when evaluating page experience as a ranking signal.
The Load-React-Settle Model
One mental model clarifies why these three metrics exist as separate measurements and why optimizing them requires different tooling. Think of the user's experience in three phases: Load (did the content appear?), React (did the page respond when I interacted?), Settle (did the layout stay put?).
LCP measures Load. INP measures React. CLS measures Settle. The phases overlap in real time, but the metrics themselves don't overlap in what they count. An LCP optimization like preloading the hero image has zero direct effect on INP or CLS. Fixing a CLS issue by adding image dimensions doesn't speed up LCP. Reducing JavaScript bundle size helps INP but only helps LCP if those scripts were render-blocking.
This independence is by design. Google's page experience documentation confirms that when multiple pages satisfy search intent at a similar level, experience becomes the differentiator. Each metric captures a dimension that the other two are blind to. Sites passing all three thresholds see roughly 24% lower bounce rates than sites failing one or more, which tracks with intuition: users stay longer when pages load visibly, respond to clicks, and don't rearrange themselves mid-read.
Where the Model Breaks
The Load-React-Settle framework covers common cases, but the metric definitions have known gaps.
LCP stops recording new candidates after any user interaction. If a user scrolls before the hero image loads, the LCP candidate freezes at whatever was largest at that moment, potentially a small navigation element. Pages with slow-loading above-the-fold content can paradoxically get good LCP scores if users scroll quickly, meaning the metric under-counts loading problems on pages where visitors don't wait.
INP's 98th-percentile approach means that on low-traffic pages with fewer than 50 total interactions in the CrUX dataset, a single slow interaction from one user can set the score. This creates volatility for pages that don't get heavy engagement. A contact page visited 30 times a month might swing between "good" and "poor" based on whether one visitor's device was running a background update during their click.
CLS's session-window model still misses shifts that happen during scroll-linked animations or intersection-observer-triggered lazy loads. A carousel that shifts content every 4.5 seconds (just under the 5-second window cap) accumulates a higher score than one that shifts every 6 seconds (which starts a new session window). The scoring rewards slower animation cadences in ways that have nothing to do with perceived visual stability.
None of these gaps invalidates the metrics. Sites that pass all three thresholds genuinely deliver better experiences than sites that don't, and Google's documentation confirms these Core Web Vitals explained as page experience signals function as tiebreakers between pages of similar relevance. But treating the numbers as perfect proxies for user satisfaction leads to optimization theater. The mechanics matter because they tell you where the measurement is trustworthy and where you need to verify with session recordings, real user monitoring, or your own eyes as a visitor to the page.
OrganicSEO.org Editorial
Editorial team writing about Ethical, white-hat, organic SEO education.
Related Articles
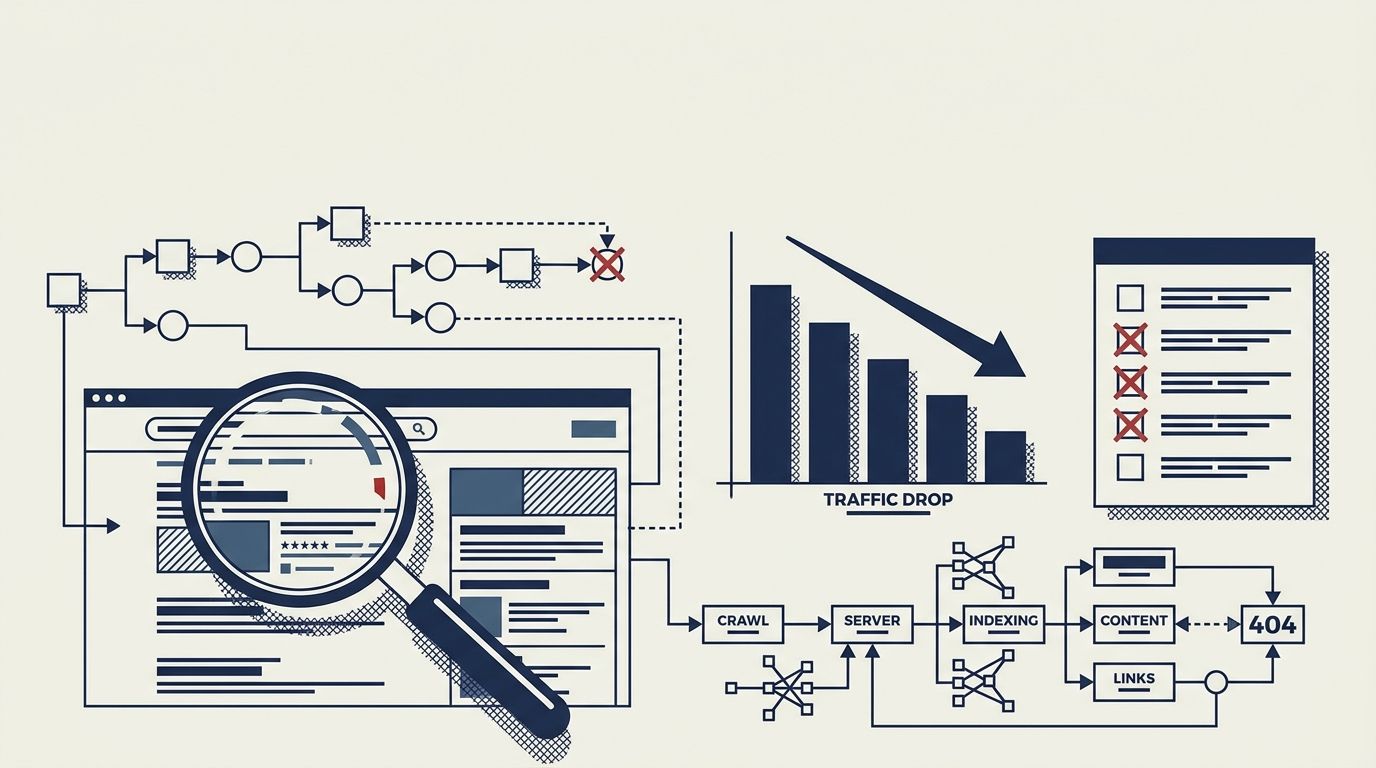
The SEO Debugging Checklist: How to Diagnose Visibility Drops Systematically (Not Frantically)
Diagnosing organic traffic drops requires a bottom-up diagnostic sequence through five layers: Crawl, Render, Index, Rank, and Click. Fixing lower layers first prevents wasted hours rewriting content that Google never crawled in the first place.

How Google's Helpful Content System Actually Scores Pages: What the Patents and Tests Tell Us
Google's helpful content system doesn't give pages a single numeric score. It uses machine-learning classifiers trained on human rater feedback, patent-documented signals, and site-level engagement data to sort content into quality tiers.
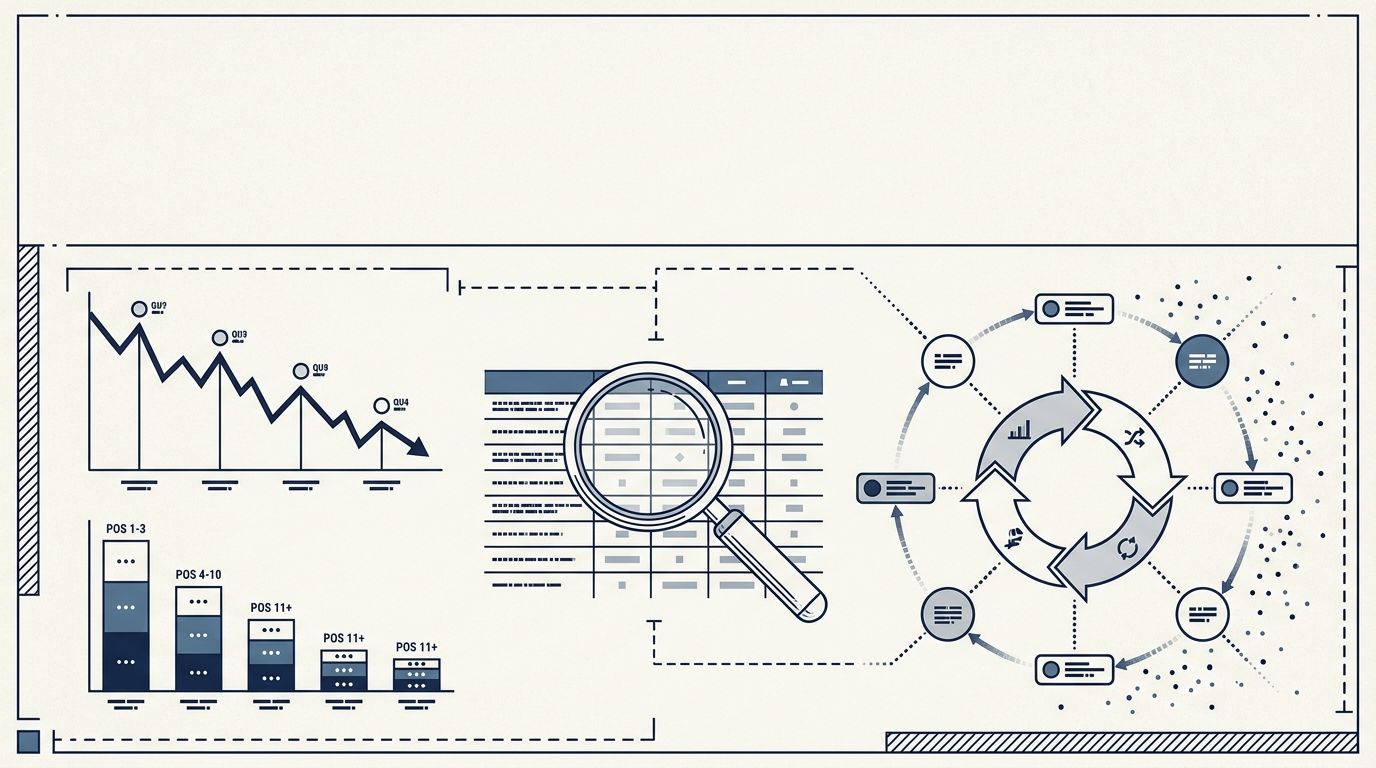
The Quarterly Keyword Refresh Cycle: How to Catch Ranking Declines Before They Compound
Ranking declines become visible in position-tracking tools 4 to 6 weeks after they first appear in impression data.