The Keyword Research Data Trap: Why Multiple Tools Contradict Each Other and How to Resolve Conflicts
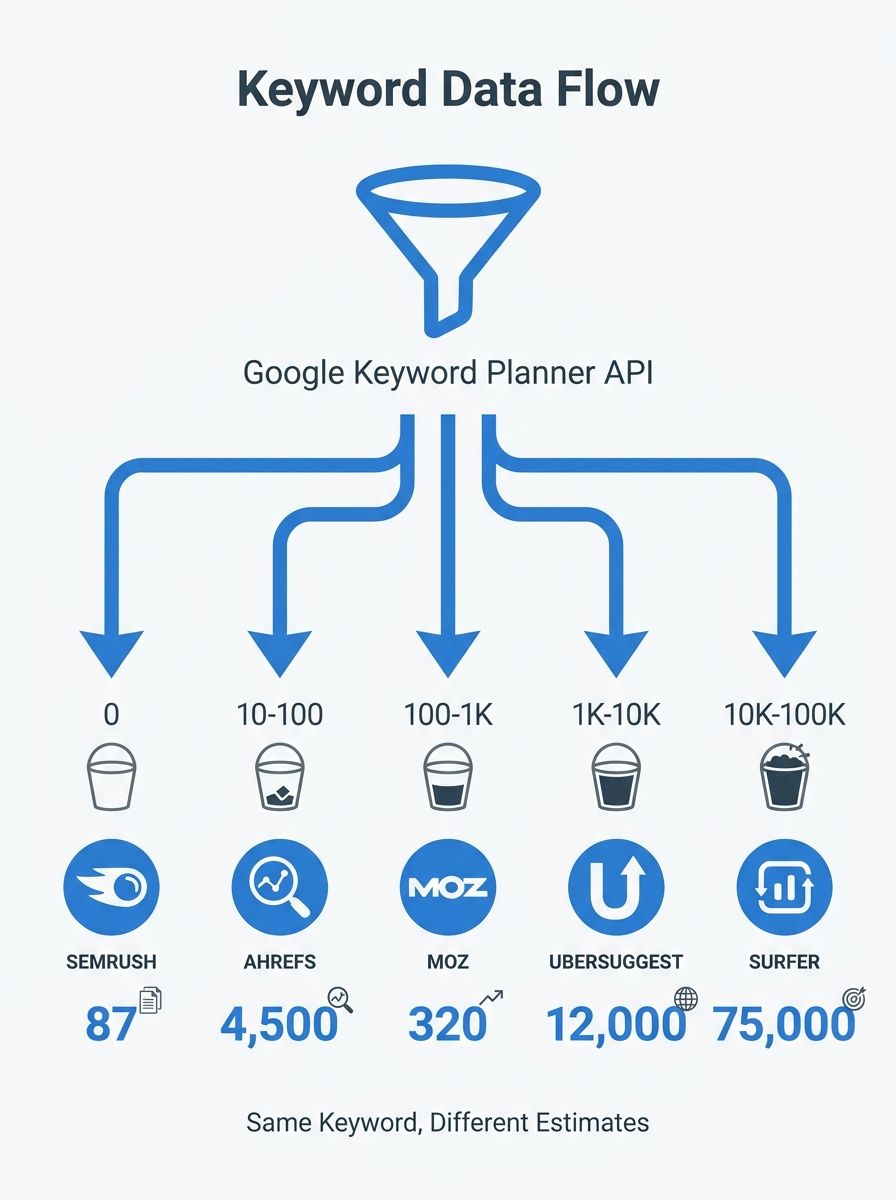
Google Ads Keyword Planner API, the single upstream source feeding search volume data into Ahrefs, Semrush, Moz, and nearly every other SEO platform, returns estimates bucketed into ranges that can span 10x.
The Keyword Research Data Trap: Why Multiple Tools Contradict Each Other and How to Resolve Conflicts
Google Ads Keyword Planner API, the single upstream source feeding search volume data into Ahrefs, Semrush, Moz, and nearly every other SEO platform, returns estimates bucketed into ranges that can span 10x. Each tool then applies its own clickstream adjustments and rounding logic, which is why keyword research tool discrepancies are structural, not accidental.
The Single Source That Feeds Everything
Why do Ahrefs, Semrush, and Moz show different search volumes for the same keyword? Because they're all interpreting the same imprecise signal differently.
Back in 2016, Google Ads stopped sharing exact search volume counts through its Keyword Planner API. Before that change, advertisers and SEO tools received granular monthly data. After it, the API began returning bucketed ranges on a logarithmic scale: 0, 10–100, 100–1,000, 1,000–10,000, 10,000–100,000, and up from there. A keyword getting 150 real searches per month and one getting 900 both land in the same "100–1,000" bucket.
This matters because, as analysis from Ellipsis confirms, "most SEO software gets its search volume data from Google Ads Keyword Planner API, which returns much more specific numbers than the web interface." Even that API-level specificity comes with a range that can stretch 10x between the floor and the ceiling of a single bucket. Every search volume figure you see in any SEO tool is an estimate built on an estimate, and the disagreement between tools starts at this shared bottleneck.
Google's rationale for the change was partly commercial (pushing advertisers toward broad match campaigns) and partly competitive (limiting the free data available to third-party tools). The practical result for practitioners: no tool receives exact numbers from Google, so no tool can report exact numbers to you.
How Clickstream Panels Create a Second Layer of Divergence
The major SEO platforms don't just accept the Keyword Planner bucket and call it a day. They supplement it with clickstream data: behavioral data collected from browser extensions, ISP partnerships, and app usage panels. Ahrefs uses clickstream data from third-party partners to refine its volume estimates and calculate metrics like clicks-per-search. Semrush uses a different set of clickstream providers with a different panel composition.
These panels vary in size and demographic coverage. A typical clickstream panel covers 100 million to 200 million devices globally, but the geographic distribution within that panel skews the data. If Panel A over-represents US desktop users and Panel B over-represents mobile users in Europe, the same keyword gets different volume projections from each. Panel composition affects every downstream number: search volume, click-through rate estimates, keyword difficulty scores, and traffic projections.
The collapse of Jumpshot in early 2020, which had been one of the largest clickstream providers covering roughly 100 million devices via Avast's antivirus software, forced several SEO tools to find alternative data partners. That transition created a visible shift in search volume accuracy across SEO tools, and the replacements haven't fully closed the gap.
So when you compare Ahrefs' volume figure to Semrush's for the same keyword, you're comparing two different statistical models built on two different behavioral samples, each trying to correct the same imprecise Google bucket. The spread between them can be 2x to 5x for mid-volume keywords and even wider for low-volume terms.
Rounding, Annualization, and Update Cadence
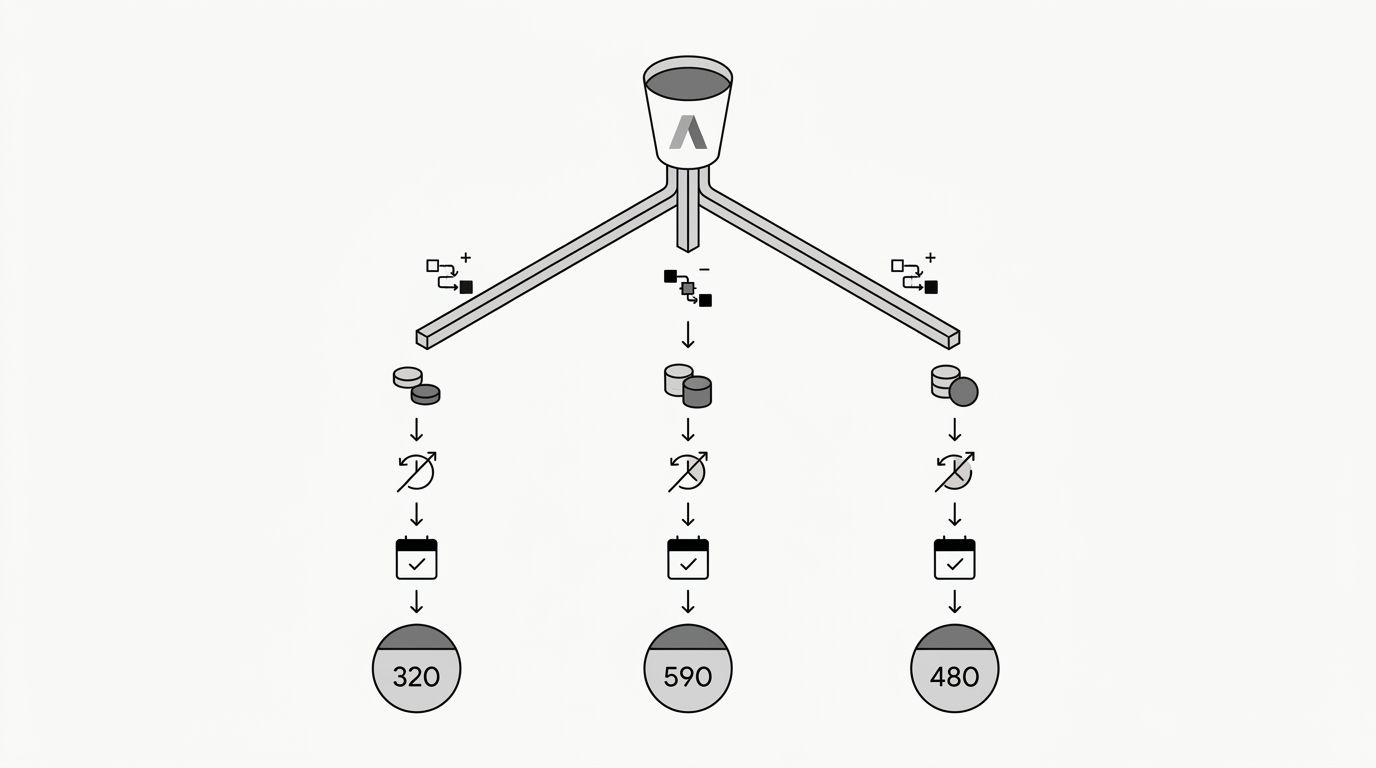
Even after adjusting for clickstream data, each tool applies its own rounding and smoothing logic. Some tools round to the nearest 10. Others round to the nearest 50 or 100. A keyword with an estimated 45 monthly searches might show as 50 in one tool, 40 in another, and 10 in a third that rounds more aggressively.
Annualization introduces additional distortion. Search volume is typically presented as a monthly average, but the underlying data is aggregated over 12 months. A keyword with extreme seasonality (say, 5,000 searches in December and 200 searches in every other month) gets averaged to roughly 600 per month. That 600 is accurate as a yearly average and misleading for 11 out of 12 months. Different tools use different averaging windows: some use trailing 12 months, others use trailing 6, and a few weight recent months more heavily.
Update cadence compounds the problem. Ahrefs refreshes its keyword database on a different schedule than Semrush, which refreshes on a different schedule than Moz. If you're comparing numbers and one tool last updated its data 3 weeks ago while another updated 8 weeks ago, you're comparing snapshots from different points in time. As the Improvado SEO analytics guide put it: "Metric conflicts are normal. GA4, GSC, Semrush, and Ahrefs report different numbers for the same metric due to methodology differences."
Keyword Difficulty Diverges Even More Than Volume
Search volume at least shares a common upstream source. Keyword difficulty (KD) scores have no shared source at all. Each tool calculates KD using its own proprietary formula. Ahrefs bases KD primarily on the number of referring domains pointing to the top 10 results. Semrush weights page authority, domain authority, and content factors differently. Moz uses its own Domain Authority and Page Authority metrics, which are themselves proxy metrics that often mislead SEOs.
A keyword might score KD 15 ("easy") in Ahrefs and KD 58 ("hard") in Semrush. Neither is wrong. They're measuring different things and calling them the same name.
Metric | Ahrefs | Semrush | Moz |
|---|---|---|---|
Volume Source | Google KP API + Clickstream A | Google KP API + Clickstream B | Google KP API + Clickstream C |
Rounding | Nearest 10 (low vol) | Nearest 10 | Nearest 50 (mid-range) |
Averaging Window | 12 months, weighted | 12 months | 12 months |
KD Formula | Referring domains to top 10 | Multi-factor (authority + content) | DA/PA of top 10 |
KD 30 Means | ~30 referring domains needed | Moderate competition | Moderate difficulty |
Refresh Cycle | Rolling, varies by keyword | Monthly bulk | Monthly bulk |
This table is the heart of why resolving contradictory keyword metrics requires understanding what each platform actually measures, not which one has the "right" number.
The Zero-Volume Trap
Mark Williams-Cook demonstrated at Brighton SEO 2022 that keywords reporting "0 volume" across tools can generate thousands of actual clicks per year in Google Search Console data. This finding has been replicated by numerous practitioners since, and it exposes one of the most consequential flaws in how tools report data.
The zero-volume problem hits hardest on long-tail queries, brand-adjacent terms, and emerging topics. Google's Keyword Planner API returns "0" for any query below a roughly 10–20 monthly search threshold. SEO tools faithfully pass that zero along, sometimes with a dash or "N/A" instead. Practitioners who filter out zero-volume keywords are systematically ignoring terms that collectively account for an estimated 30–40% of many sites' actual organic traffic.
This is where the question of which SEO tool data to trust starts resolving. If tools disagree about whether a keyword gets 50 or 200 monthly searches, the debate is about magnitude. If tools report "0" for keywords driving real traffic, the disagreement is about existence. And the only source that reports reality is your own Google Search Console, which records actual impressions and clicks for queries your pages already appear for.
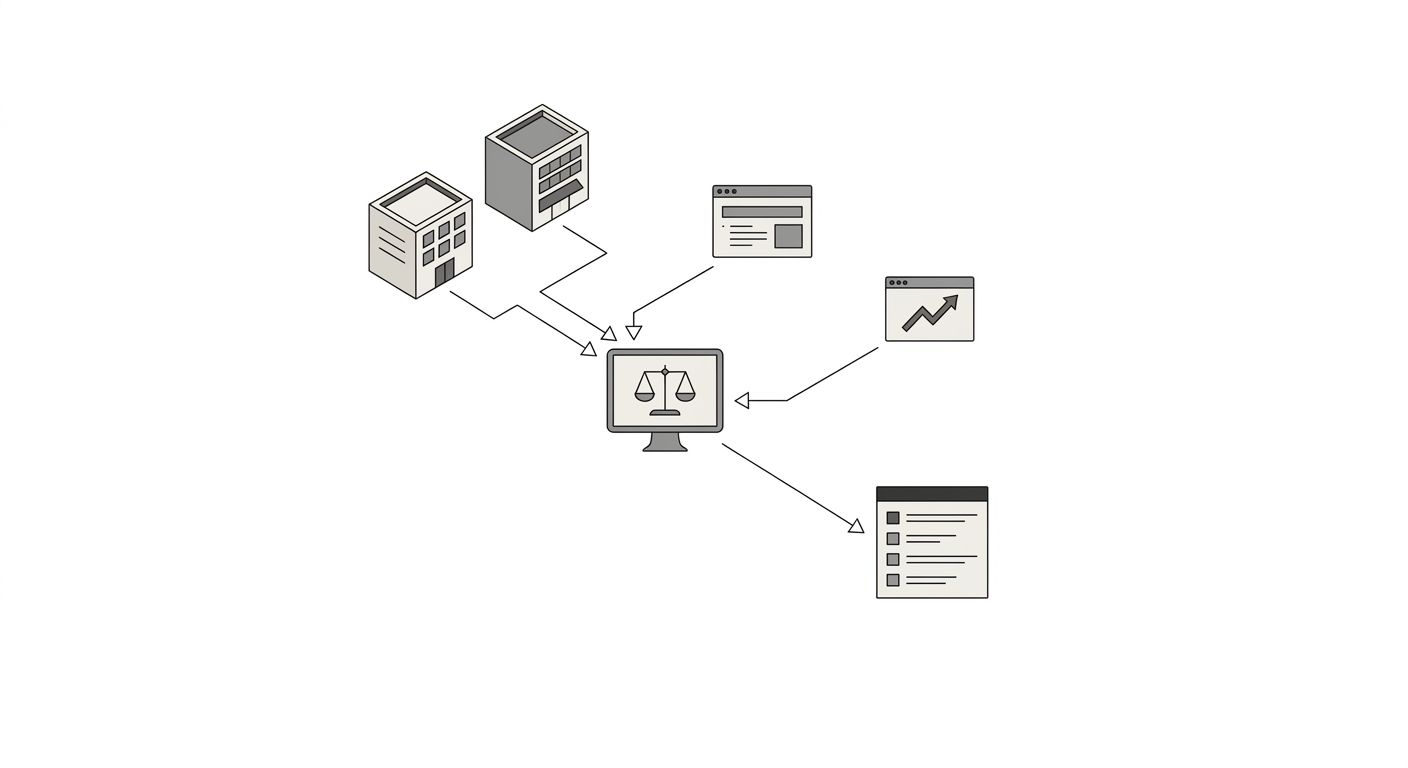
Cross-Validation with the Three-Source Framework
No single tool provides ground truth. Accepting that fact is step one. Step two is building a triangulation process. The Three-Source Framework pairs any two third-party tools with Google Search Console as the arbitrating source.
Here's how it works:
Pull volume estimates from your primary and secondary tools. If Ahrefs says 500 and Semrush says 1,200, note the range. Don't average them. The range itself is useful information about confidence level.
Check Google Search Console for existing impression or click data. If you already rank for the keyword (even at position 40+), GSC gives you actual impression counts over a defined period. This is the closest thing to ground truth that exists.
Use Google Trends as a directionality check. Trends won't give you absolute volume, but it shows whether a keyword is growing at 15% quarter-over-quarter, holding flat, or declining. This context makes a Semrush figure of 1,200 feel plausible (growing trend) or suspicious (declining trend).
When you're building keyword strategy around search intent rather than raw volume, the exact volume number matters less than relative prioritization. Ryan Robinson, who tested volume accuracy across four keyword tools, argued that these tools are "best used as validation and prioritization tools, not as a source of truth for developing your entire strategy".
The question of which SEO tool data to trust resolves into a more practical question: which tool's relative ranking of keywords by opportunity most closely matches your Search Console actuals? Run that comparison once with 50–100 keywords you already rank for, and you'll know which tool to lean on for new keyword discovery going forward.
Where This Mechanism Breaks
The Three-Source Framework fails in three identifiable situations, and knowing those boundaries prevents false confidence.
New keywords with no GSC history. If you haven't ranked for a term at all, Search Console provides zero arbitrating data. You're stuck with third-party estimates and Google Trends directionality. For genuinely new keywords, search volume accuracy across SEO tools drops to its worst, and your confidence interval should be proportionally wide. Plan for the lower bound of your tool range, not the upper.
Highly seasonal or event-driven terms. Annualized averages obscure the actual search pattern. A keyword averaging 500/month might peak at 4,000 in November and bottom out at 50 in July. Both tools show 500, but neither tells you when the searches happen. Google Trends is the only freely available tool that exposes this curve, and even it shows relative interest on a 0–100 scale rather than absolute volume.
Non-English and regional queries. Clickstream panels skew heavily toward English-speaking markets. For keywords in languages or regions with thinner panel coverage, the adjustment layer on top of Google's Keyword Planner buckets becomes largely guesswork. Volume estimates for Japanese, Arabic, or Portuguese long-tail keywords can be off by 5x–10x, and keyword difficulty scores in these markets are even less reliable because the tools' backlink indices have sparser coverage. If you're doing geo-targeted keyword work, plan for wider error margins and heavier reliance on GSC validation.
The keyword research data trap, ultimately, is the belief that these numbers should agree and that disagreement signals a broken tool. The mechanism producing the disagreement is well understood: a deliberately imprecise upstream source, divergent proprietary corrections, different rounding and timing, and incompatible difficulty formulas. Knowing why the numbers disagree gives you a better keyword research methodology for conflicting data than switching tools ever could. The tools are useful for relative comparison within a single platform's dataset. They fall apart when you compare absolute numbers across platforms and expect agreement that the underlying data pipeline was never designed to produce.
OrganicSEO.org Editorial
Editorial team writing about Ethical, white-hat, organic SEO education.
Related Articles
Why Your Keyword Research Tools Disagree on Search Volume (And How to Break the Tie)
Store Growers tested 10 commercial keywords across Google Keyword Planner, Semrush, Ahrefs, and SpyFu and found that no two tools agreed on volume for a single term.
Keyword Research Data Conflicts in 2026: Why Ahrefs, Semrush, and Google Keyword Planner Give Different Numbers (And What to Do About It)
Ahrefs, Semrush, and Google Keyword Planner report different search volume numbers for the same keywords because each tool collects, models, and categorizes search data through fundamentally different methods.

Beyond Search Volume: Why Keyword Research Tools Miss Half Your Opportunity in 2026
Roughly 15% of the queries Google processes each day have never appeared in any keyword research tool's index. That figure represents the floor of what volume-based research misses, before accounting for the queries tools do track but measure with wildly conflicting numbers across platforms.